Early Fire Detections
Satellite detections in remote areas of Canada and the United States.
2025 to 2026 · Reporting periodEARTH OBSERVATION | OPERATIONAL PERSPECTIVE
Satellite observations, AI, and environmental data to understand risk and plan your response.
Wildfire
Infrastructure
Transportation
Marine & environment
From environmental signals to maps, scenarios, and decisions on the ground.
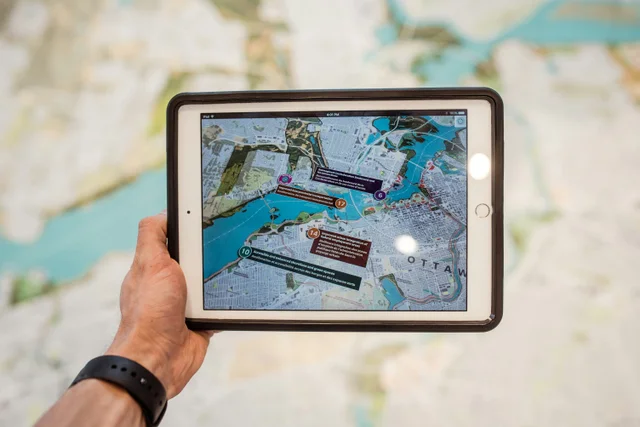
Combine satellite, weather, and site data.
Reveal patterns and change in a shared spatial view.
Explore scenarios with uncertainty in view.
Deliver maps, asset context, and reports.
EOSENSING IN NUMBERS
Satellite detections in remote areas of Canada and the United States.
2025 to 2026 · Reporting periodWildfire exposure assessed across forests, rural regions, and community edges.
Railways, power corridors, and other infrastructure monitored across varied environments.
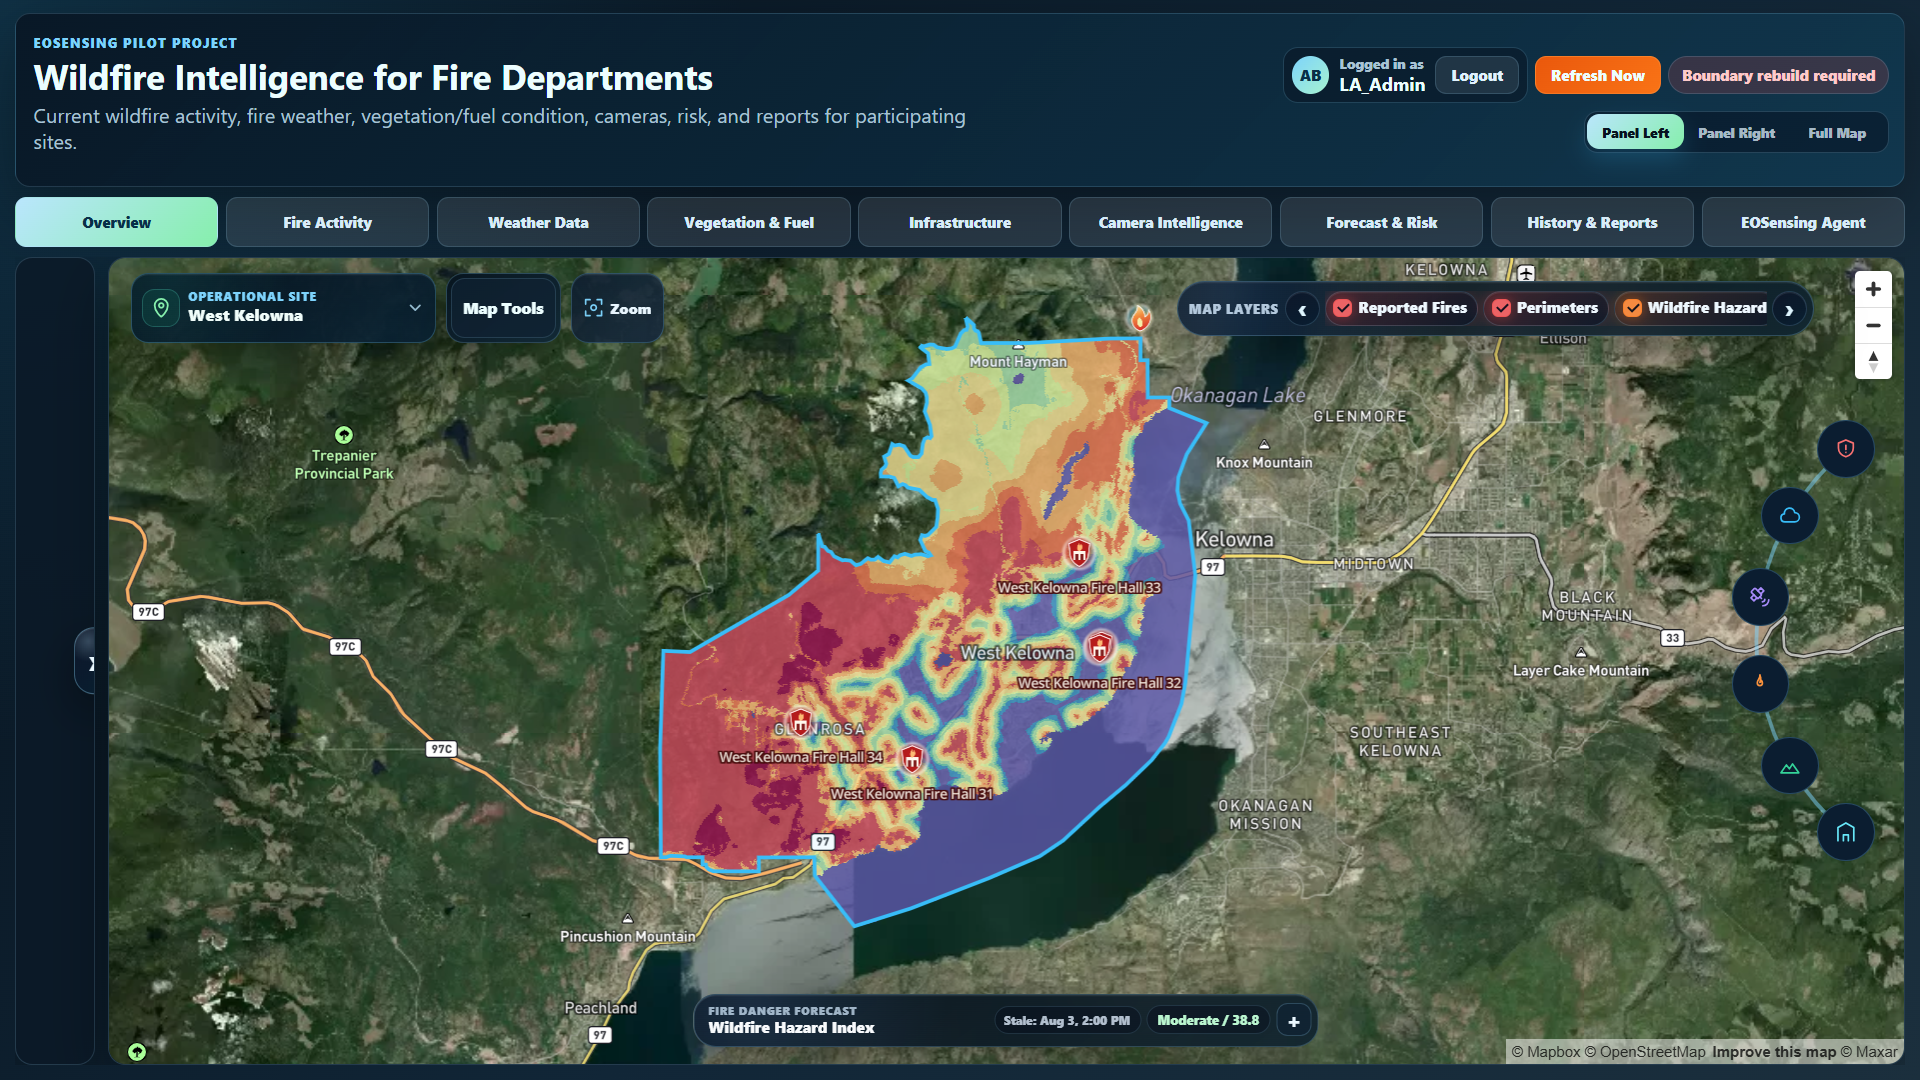
Fire activity, changing conditions, and spread scenarios in one operational map.
Discuss a demo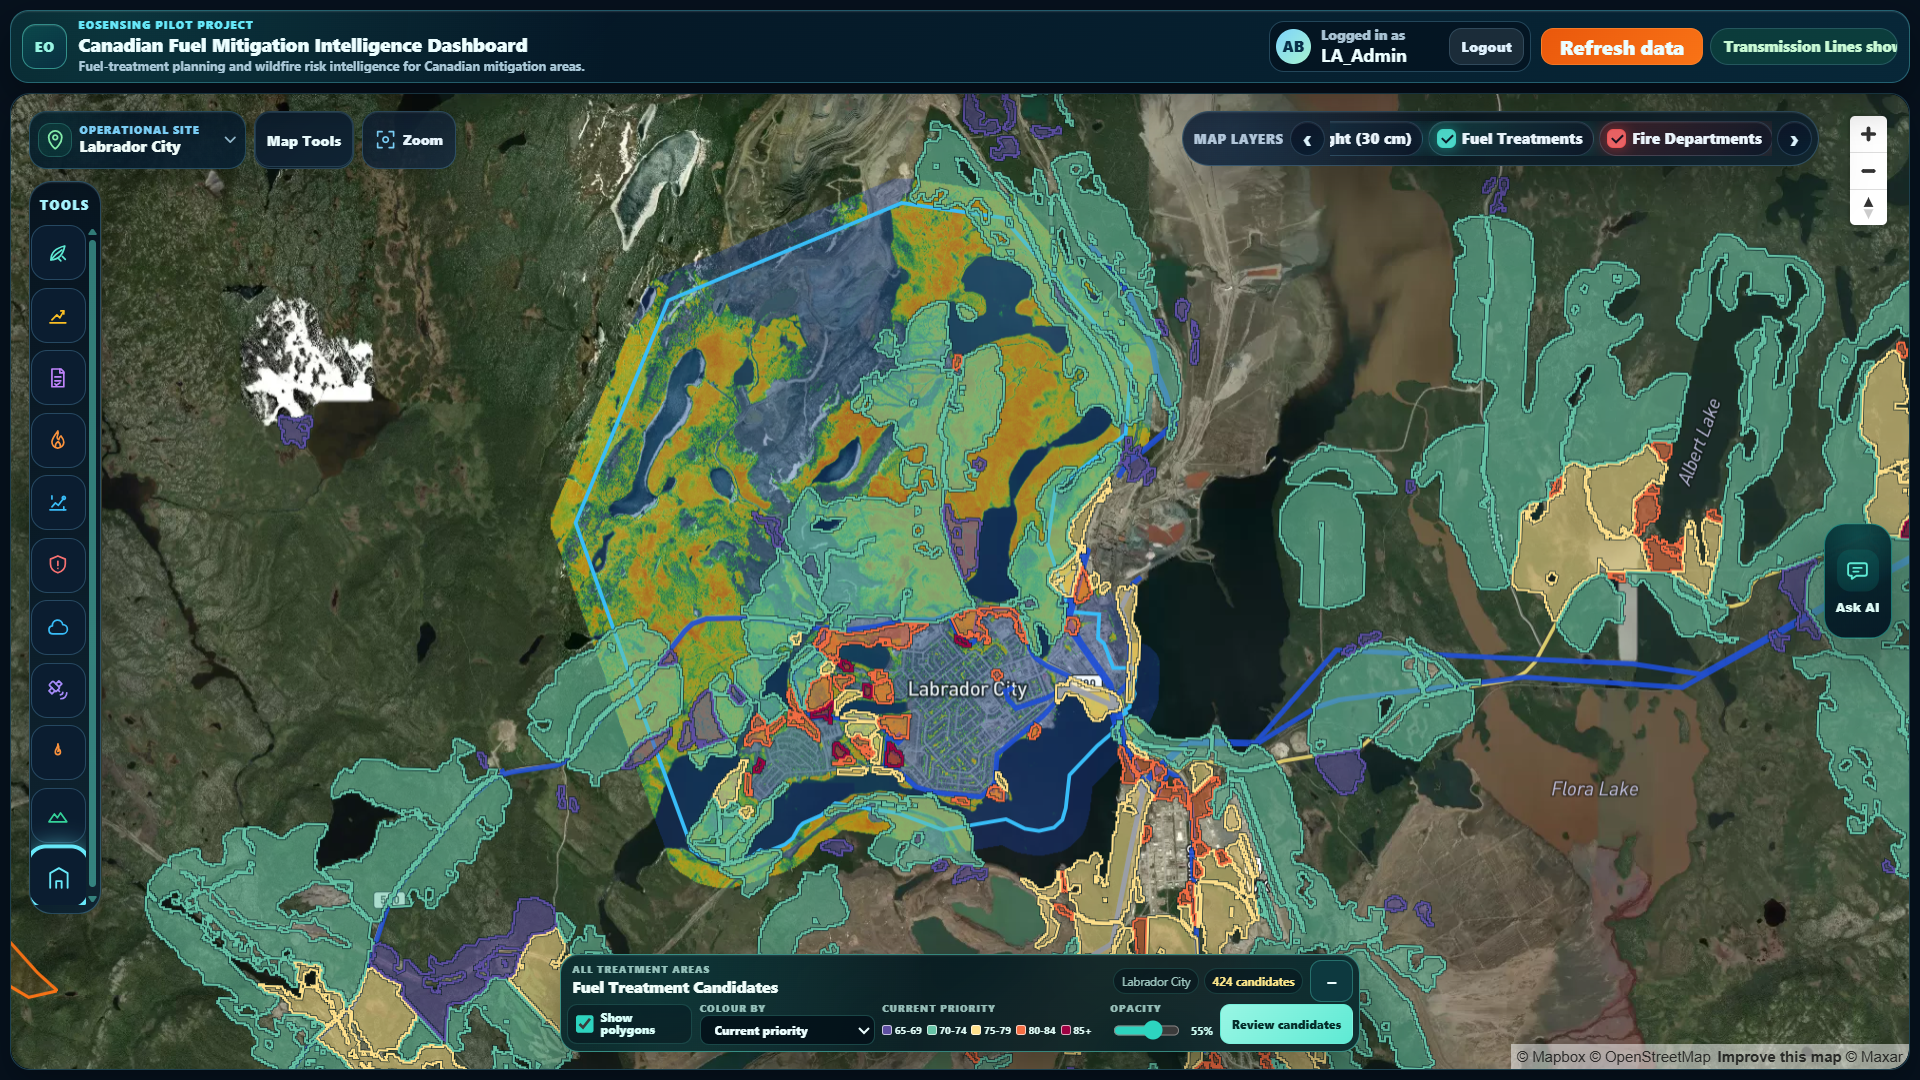
Prioritize fuel treatments, compare scenarios, and connect planning with field evidence.
Discuss a demoExplore fire activity, risk, spread scenarios, and exposed assets.
Fire observations + asset context
NORTH RIDGE | SCENARIO 01
Thermal observations highlight where to investigate. Compare their locations with terrain and nearby infrastructure.
NORTH RIDGE | SCENARIO 01
Compare terrain, vegetation, and weather context to identify areas that warrant closer attention.
Fire observations + asset context
NORTH RIDGE | SCENARIO 01
Explore a spread scenario over six hours and its possible impact on nearby corridors and assets.
NORTH RIDGE | SCENARIO 01
Compare infrastructure locations with fire observations and spread scenarios to focus further assessments.
FEATURED PRODUCT | MOBILE WEB APP
Your Journey
A Clearer Outlook
Wildfire activity, smoke forecasts, and air quality in one mobile map for your places and the roads between them.
Explore official fire records, smoke, and observed air quality.
Check nearby fires and forecast smoke along your drive.
Explore AI briefings with source links and reported changes.
Save fire watches and trip snapshots on your device.
Built around Canada & the United States
Six capabilities working together, from observation to action.
Map terrain, vegetation, and assets to understand proximity and exposure.
Find patterns in imagery and environmental data for informed human review.
Combine satellite observations to track fire activity and landscape change.
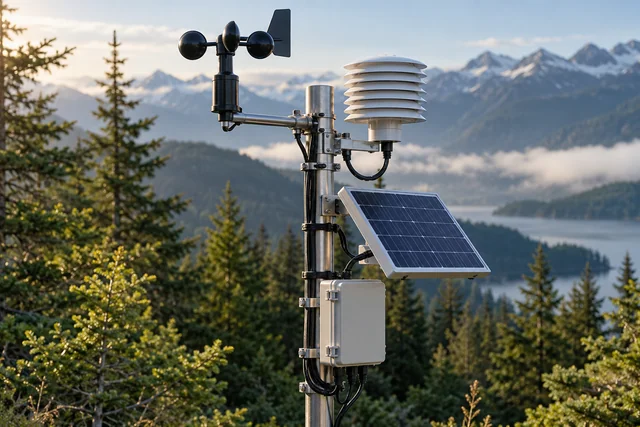
Integrate available weather and sensor readings for local context.
Connect camera views with maps for site and corridor review.
Query site data and prepare briefings, with operators in control.
EOSENSING | SATELLITE INTELLIGENCE
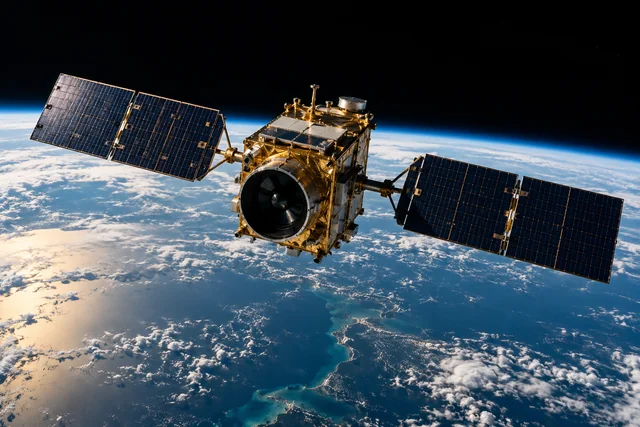
Our detection algorithm brings thermal signals and optical imagery from multiple satellites into one view of potential fire activity.
Match related detections by location and observation time.
Group overlapping observations into events for focused review.
Explore each event with its sources, confidence, and available imagery.
EOSENSING | CAMERA INTELLIGENCE
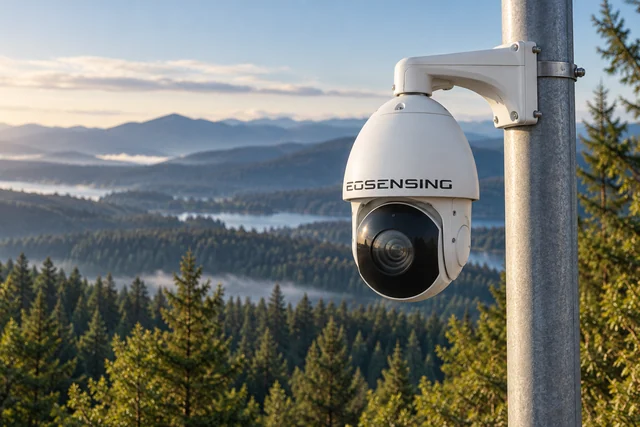
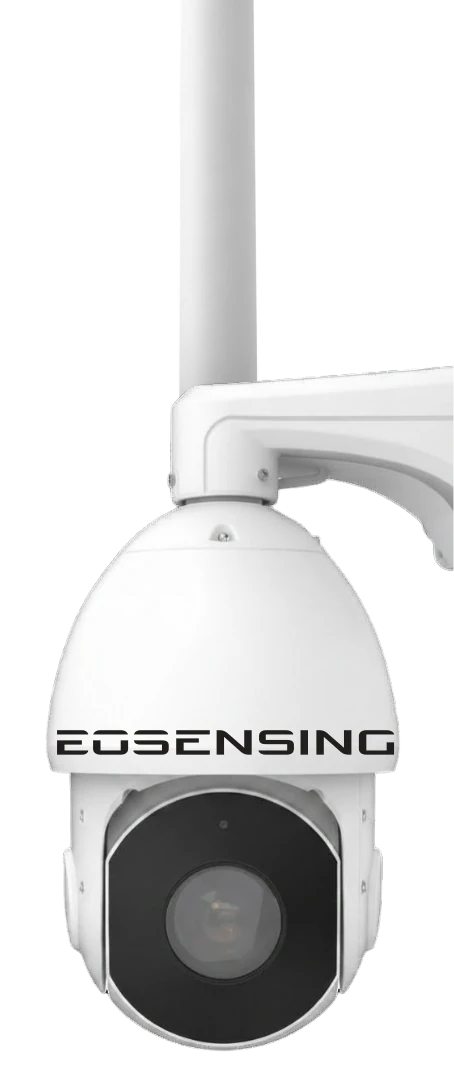
Connect remote camera views with satellite context for wildfire and railway corridor review.
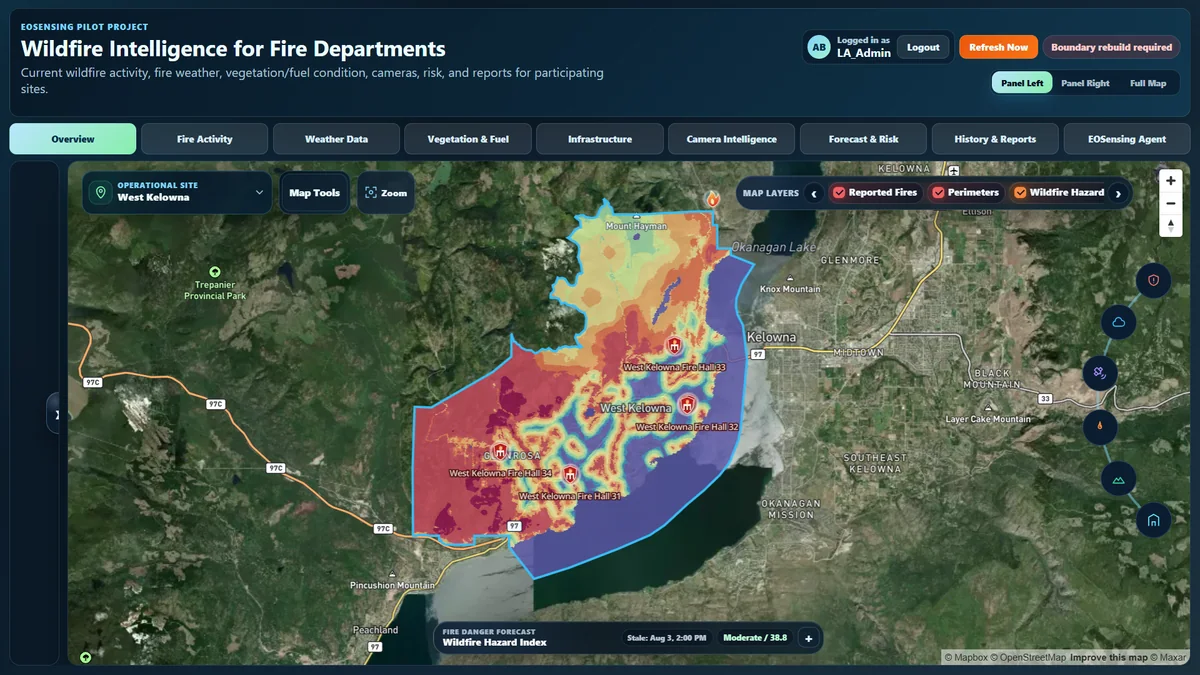
INFRASTRUCTURE & PROPERTY
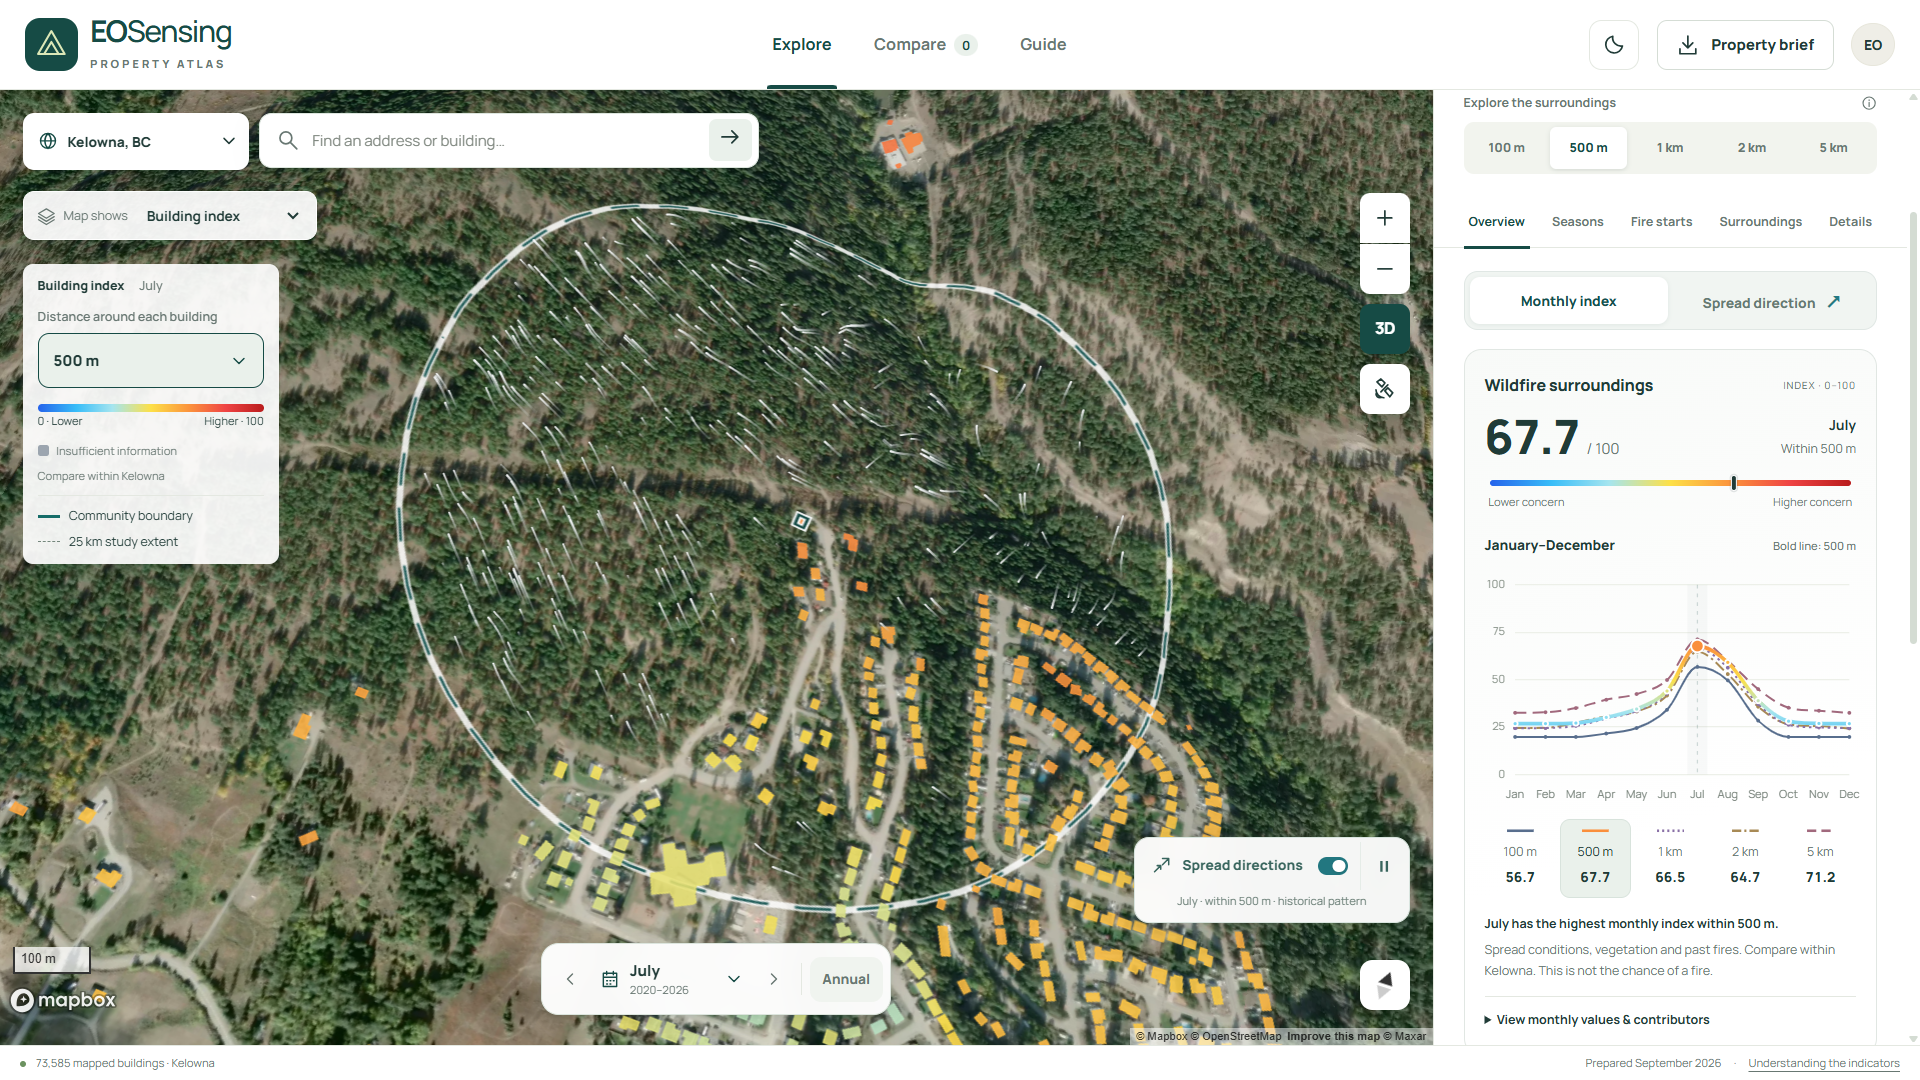
Review wildfire exposure along power corridors and identify assets for closer attention.
Request a demo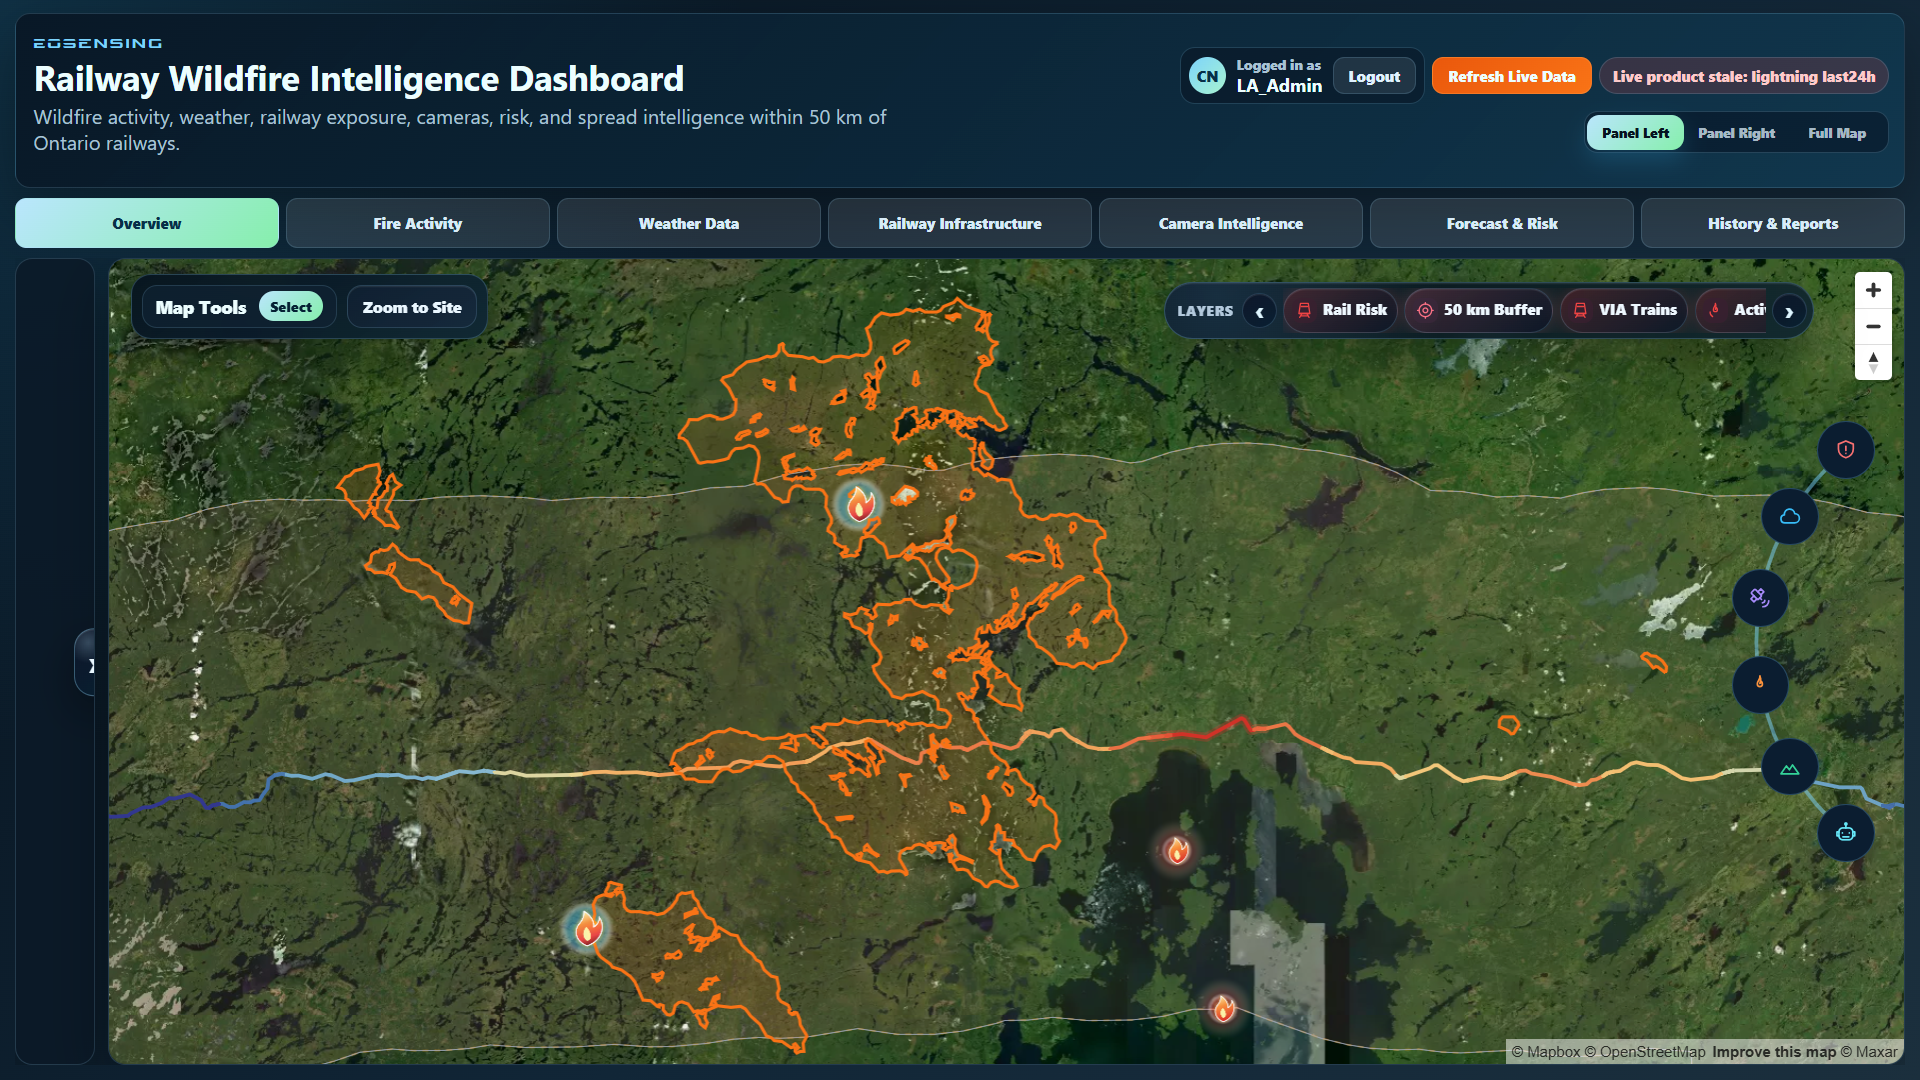
Connect railway segments with fire, lightning, weather, and local scenario analysis.
Request a demo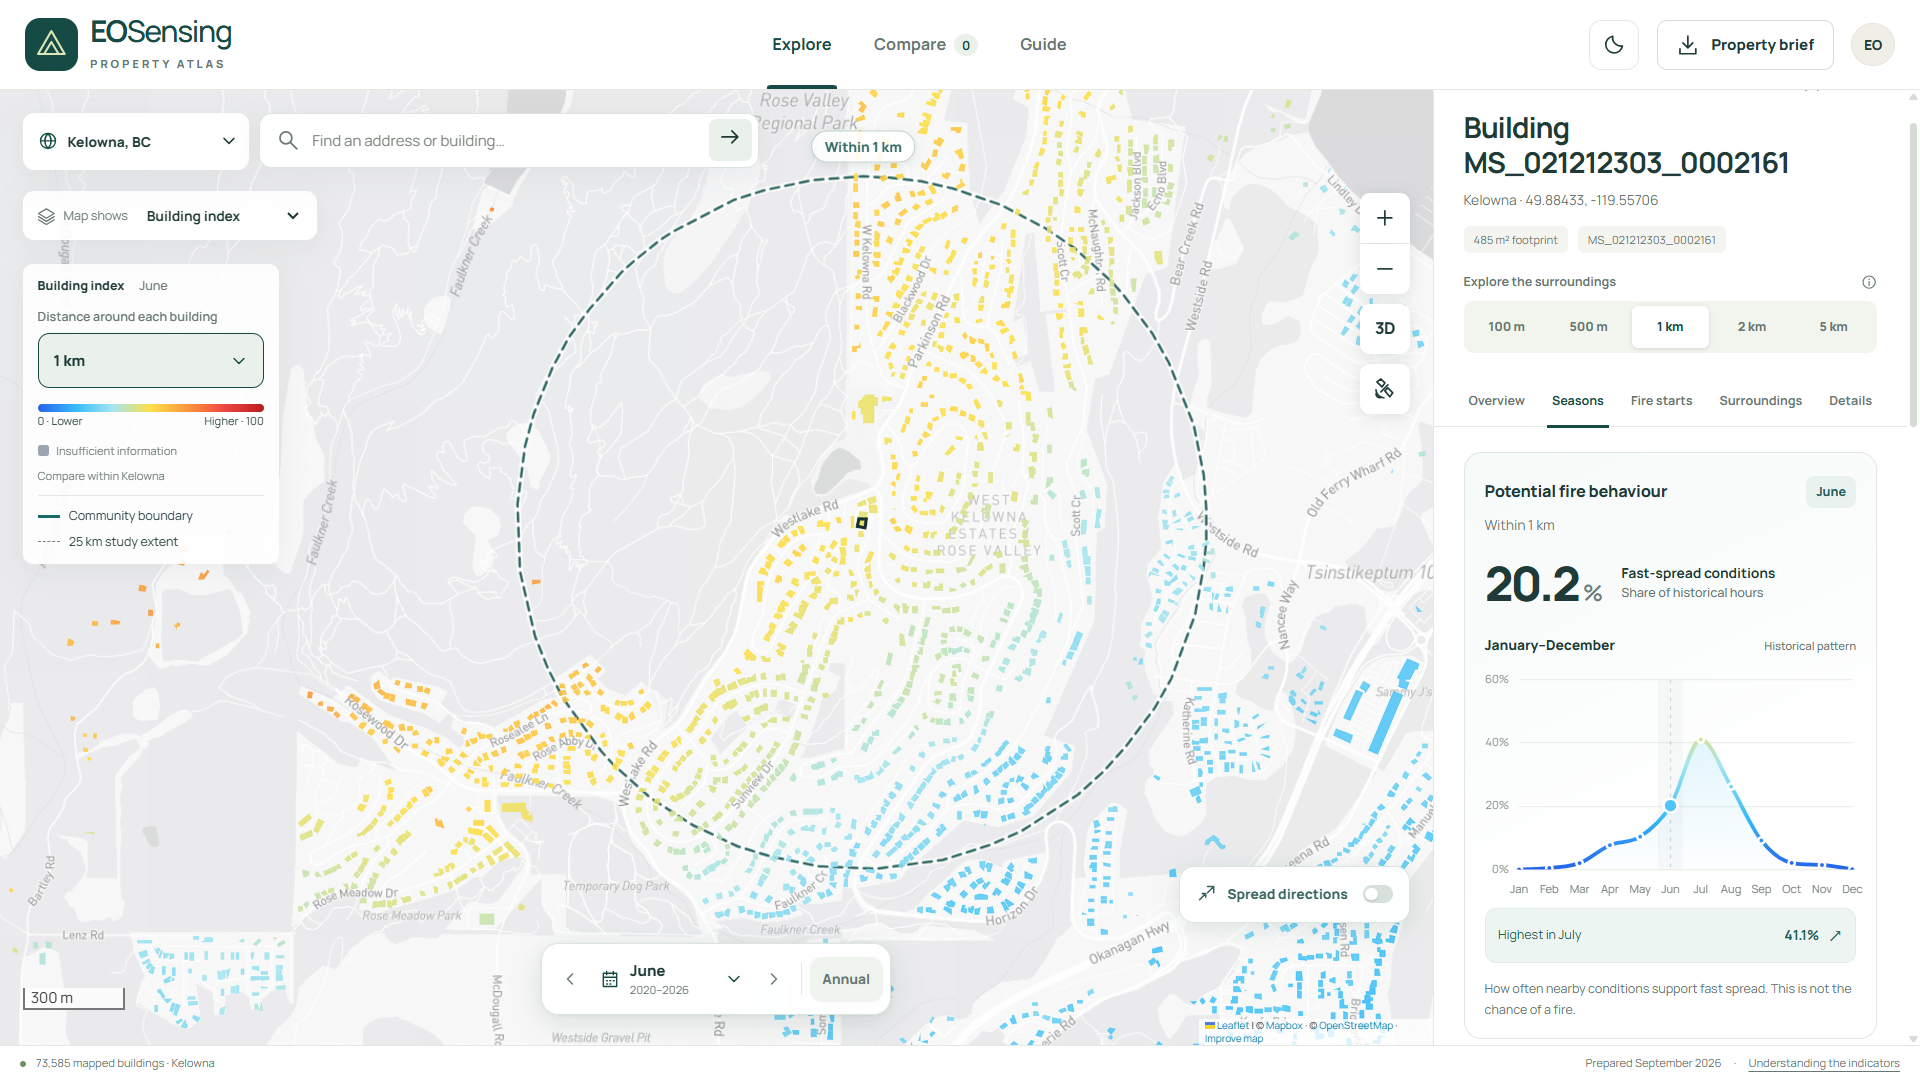
Explore wildfire surroundings and seasonal patterns around individual buildings for property due diligence.
Discuss a demoINDUSTRIES
Built around the assets, people, and places you protect.
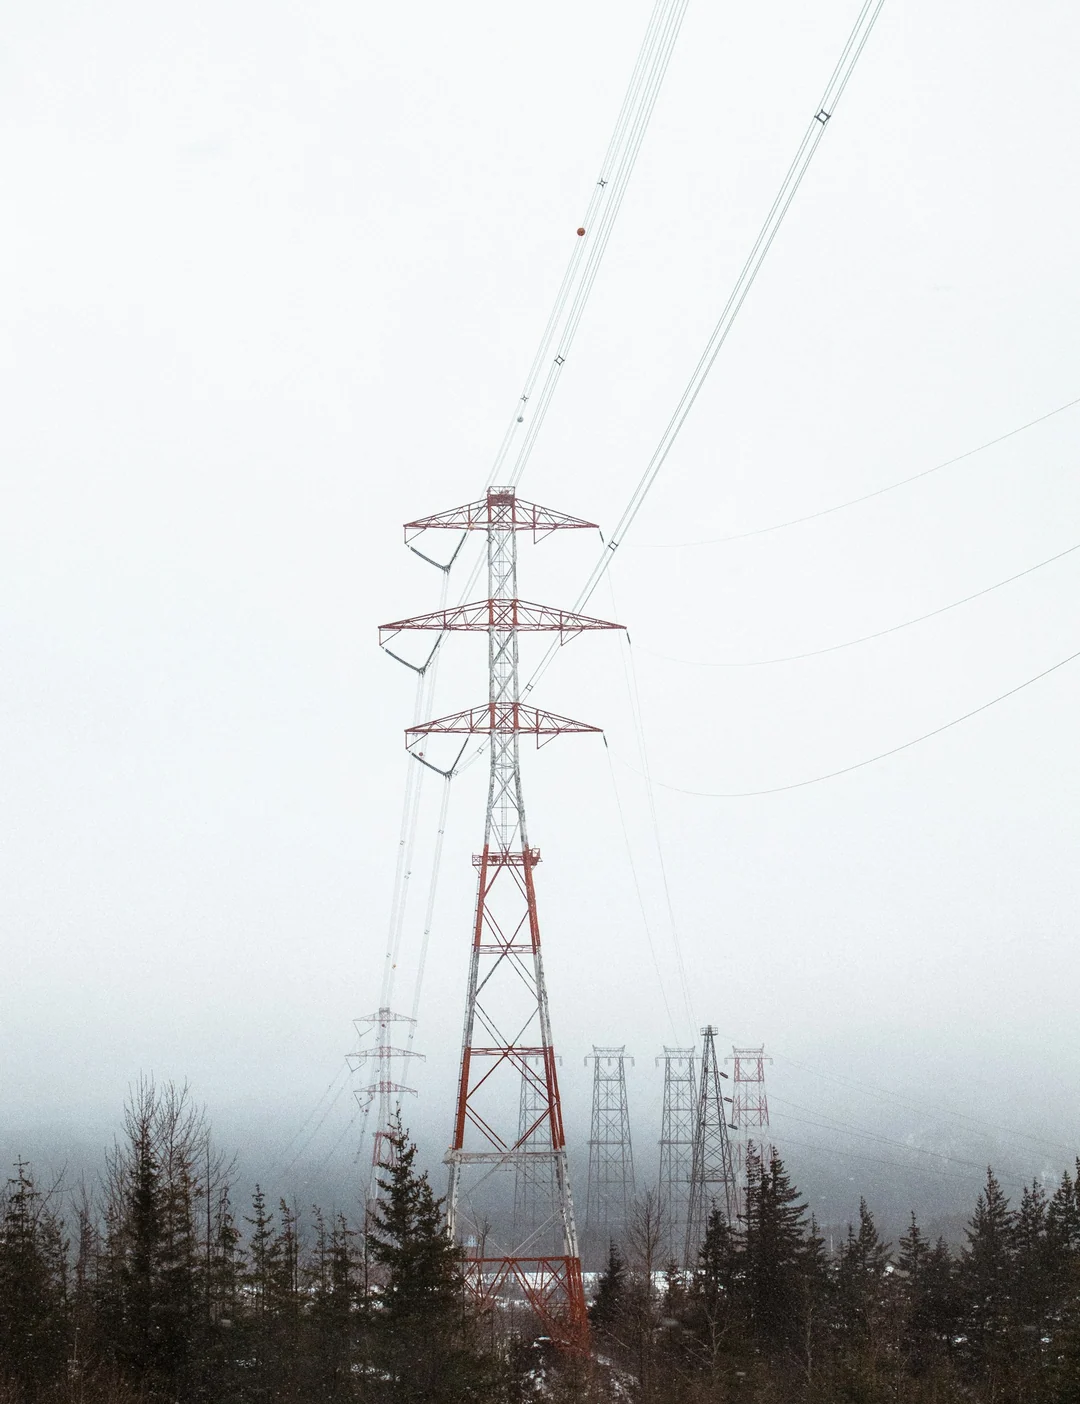
Wildfire exposure along power corridors and around critical assets.
Explore the solution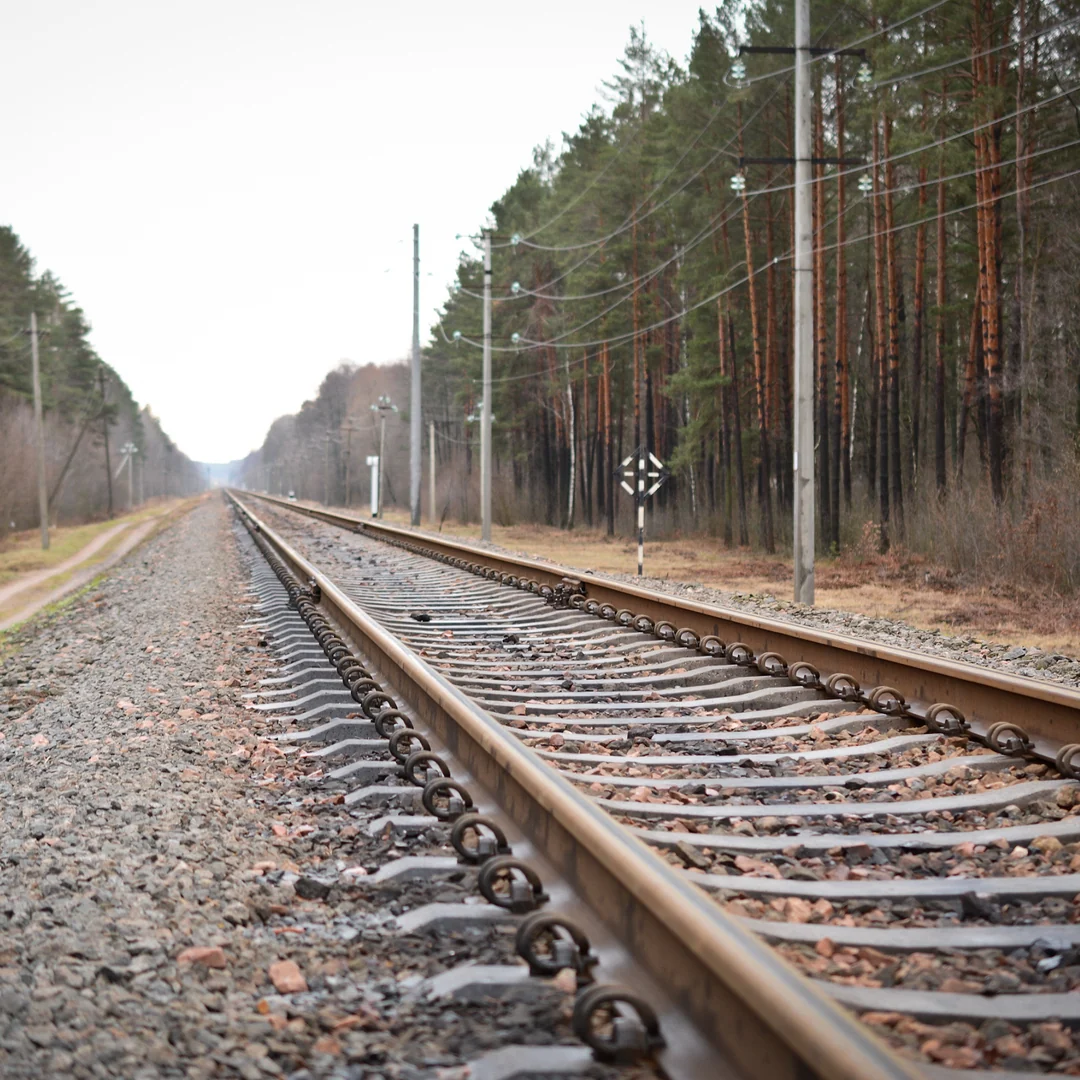
Fire activity, weather, and conditions along railway corridors.
Explore the solution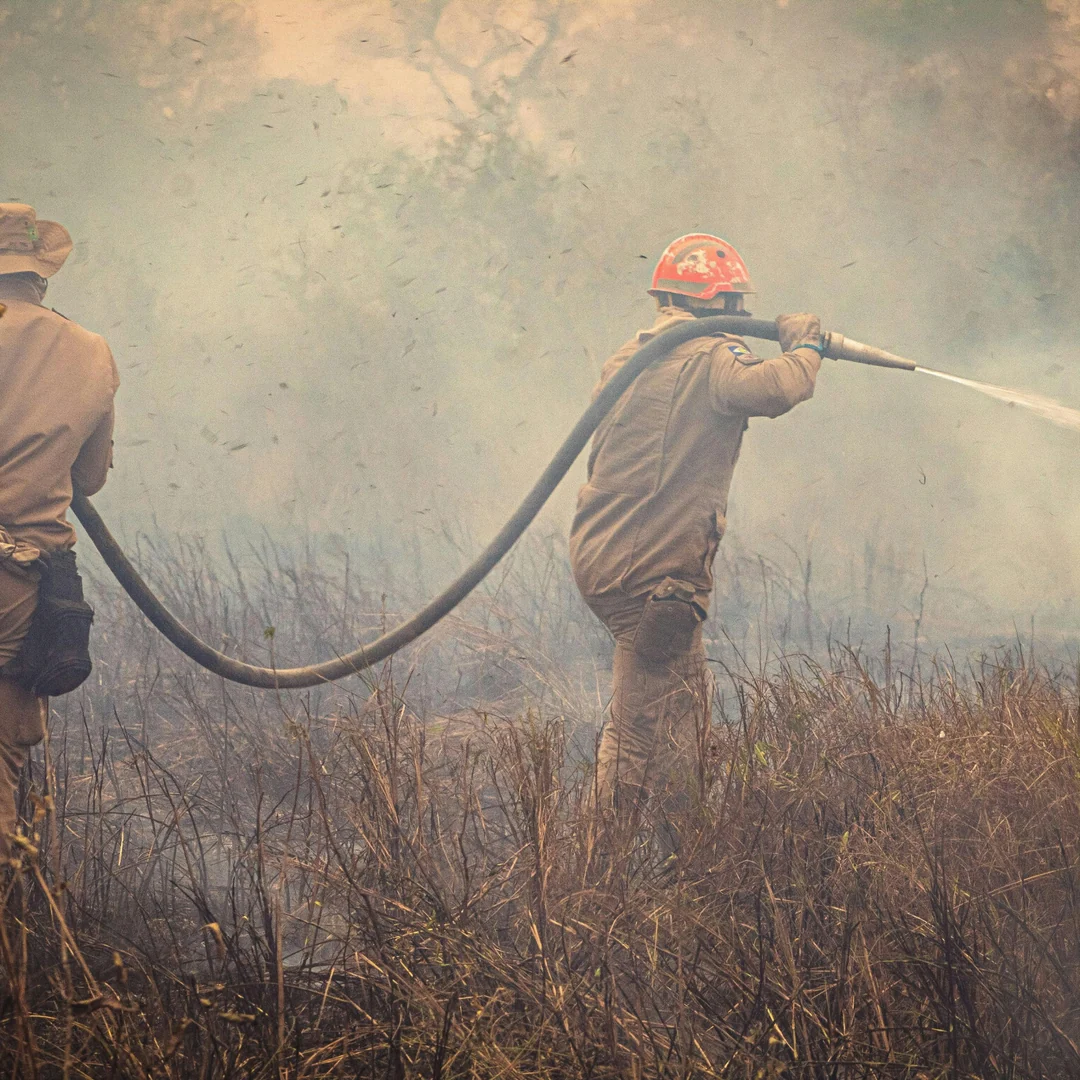
Detection evidence and scenarios to support response planning.
Explore the solution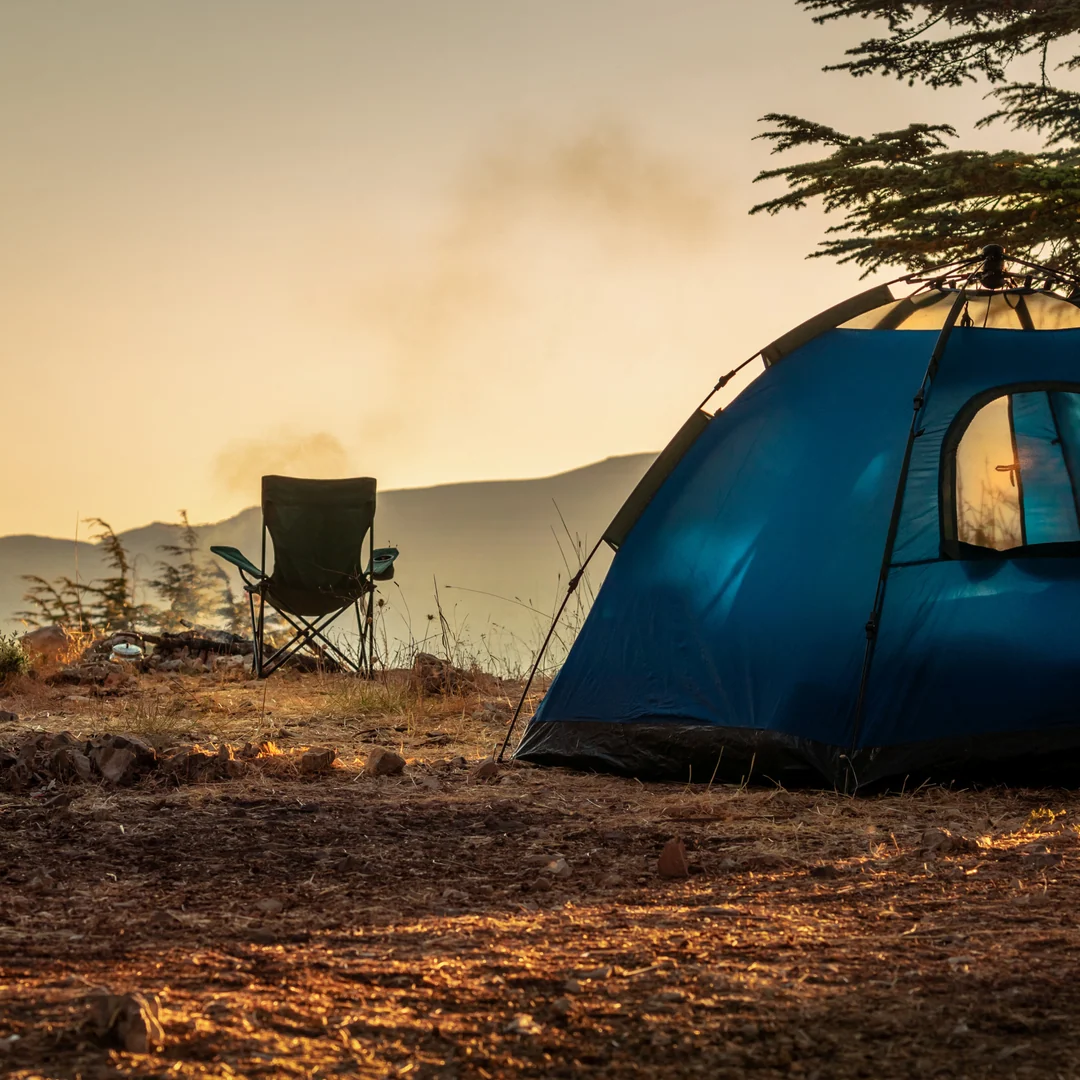
Fire and smoke context for destinations and routes.
Discover Fireline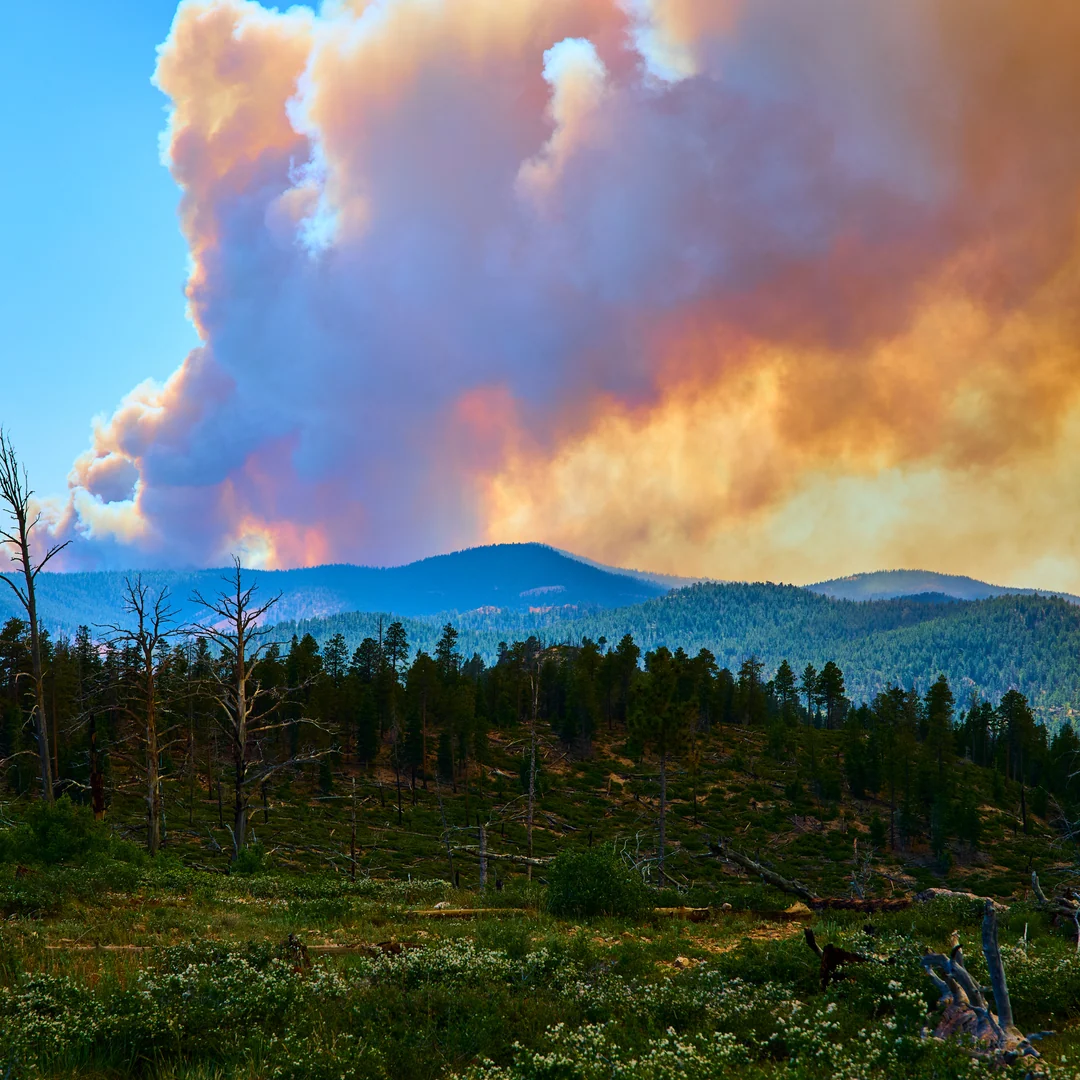
Property surroundings and seasonal wildfire exposure.
Discuss property intelligence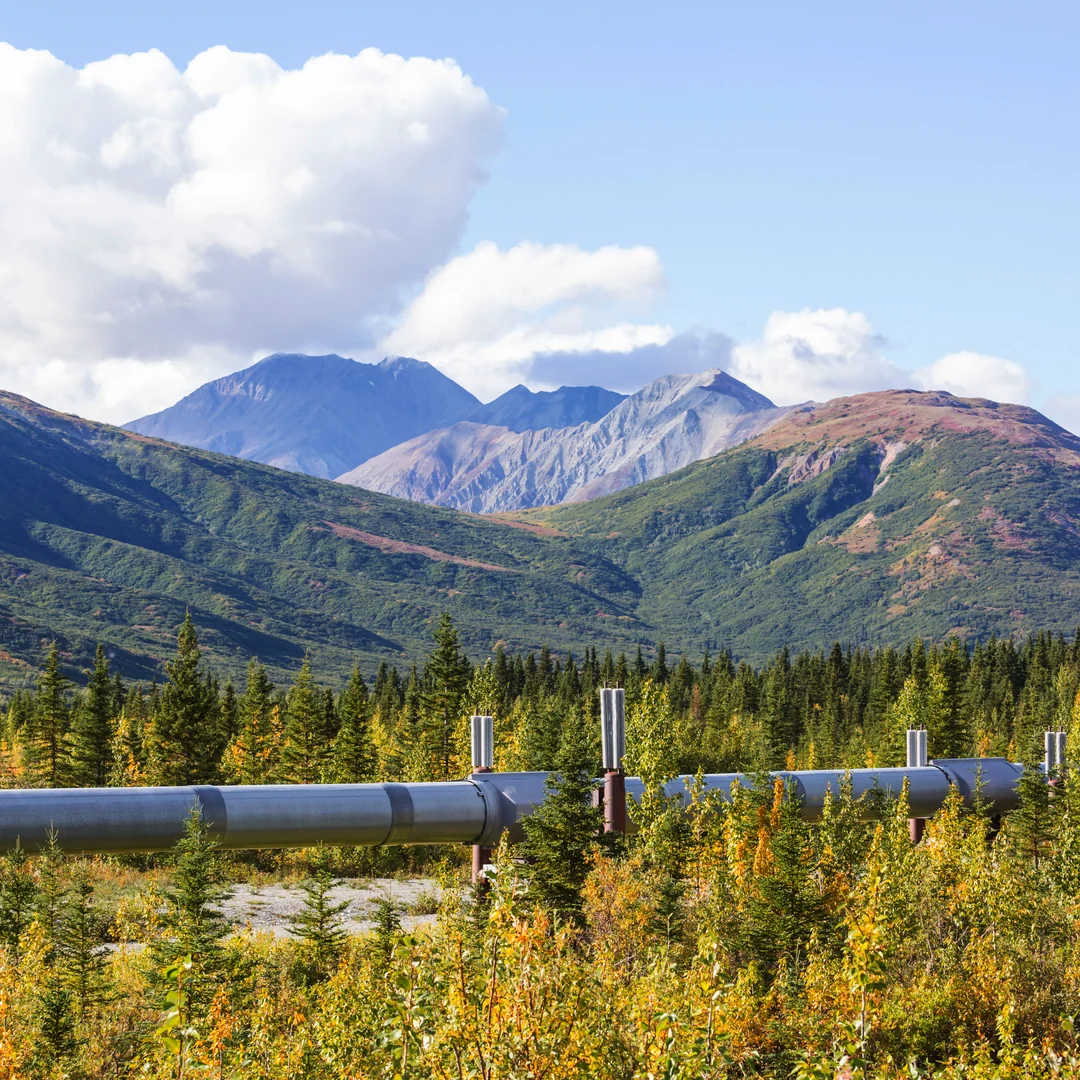
Environmental exposure around pipelines, facilities, and remote assets.
Discuss your operationElectrical photograph: Deric / Unsplash
OCEAN & COASTAL INTELLIGENCE
Track moving hazards, understand marine conditions, and put activity at sea in context.
Follow potential iceberg targets and understand how their movement could affect offshore sites.
Screen prepared radar observations and compare targets with vessel position data.
Connect observations over time to review target history and movement.
Explore drift corridors, uncertainty, and closest approach to your site.
Candidate targets need confirmation. Drift forecasts are scenarios with uncertainty.
Explore this applicationBring marine hazards and changing sea conditions into the context of platforms, floating facilities, and offshore energy sites.
Review site boundaries and monitoring zones.
Combine iceberg or bloom exposure with waves, currents, wind, and visibility.
Inspect source freshness, warning reasons, and the evidence behind site exposure.
Decision support for operator review, alongside approved procedures and authoritative forecasts.
Explore this applicationConnect fishing activity with environmental conditions around fishing grounds and aquaculture sites.
Explore apparent fishing effort and patterns of vessel presence.
Review water temperature, chlorophyll, and sensor observations linked to each site.
Examine potential bloom movement and changing conditions around sea farms.
Fishing activity indicates apparent effort, not fish abundance or catch volume.
Explore this applicationScreen chlorophyll anomalies and explore how currents may carry them toward coastal sites.
Compare recent chlorophyll observations with a historical baseline.
Review potential movement, uncertainty footprints, and site exposure.
Use source quality and local observations to guide closer review and sampling.
Satellite indicators do not confirm harmful species or toxicity; biological sampling is needed.
Explore this applicationExplore a tailored view of vessel activity, emissions records, and environmental conditions around ports and shipping areas.
Review available regional methane hotspots and air quality information.
Add emissions records and fuel data for individual vessels, along with suitable activity models.
Keep measured concentrations, reported emissions, and modelled estimates distinct.
Attributing emissions to individual ships requires additional data and validation. Regional methane observations alone cannot identify a ship’s emissions.
Discuss an emissions workflowBring vessel movements, harbour conditions, and coastal context into the same workspace.
Review available AIS positions, vessel identities, trails, and historical presence.
Examine radar layers showing vessel presence alongside reported vessel activity.
Connect weather, waves, views from port cameras, and regional depth information.
Feed coverage and freshness vary. Regional bathymetry does not replace navigation charts.
Explore this application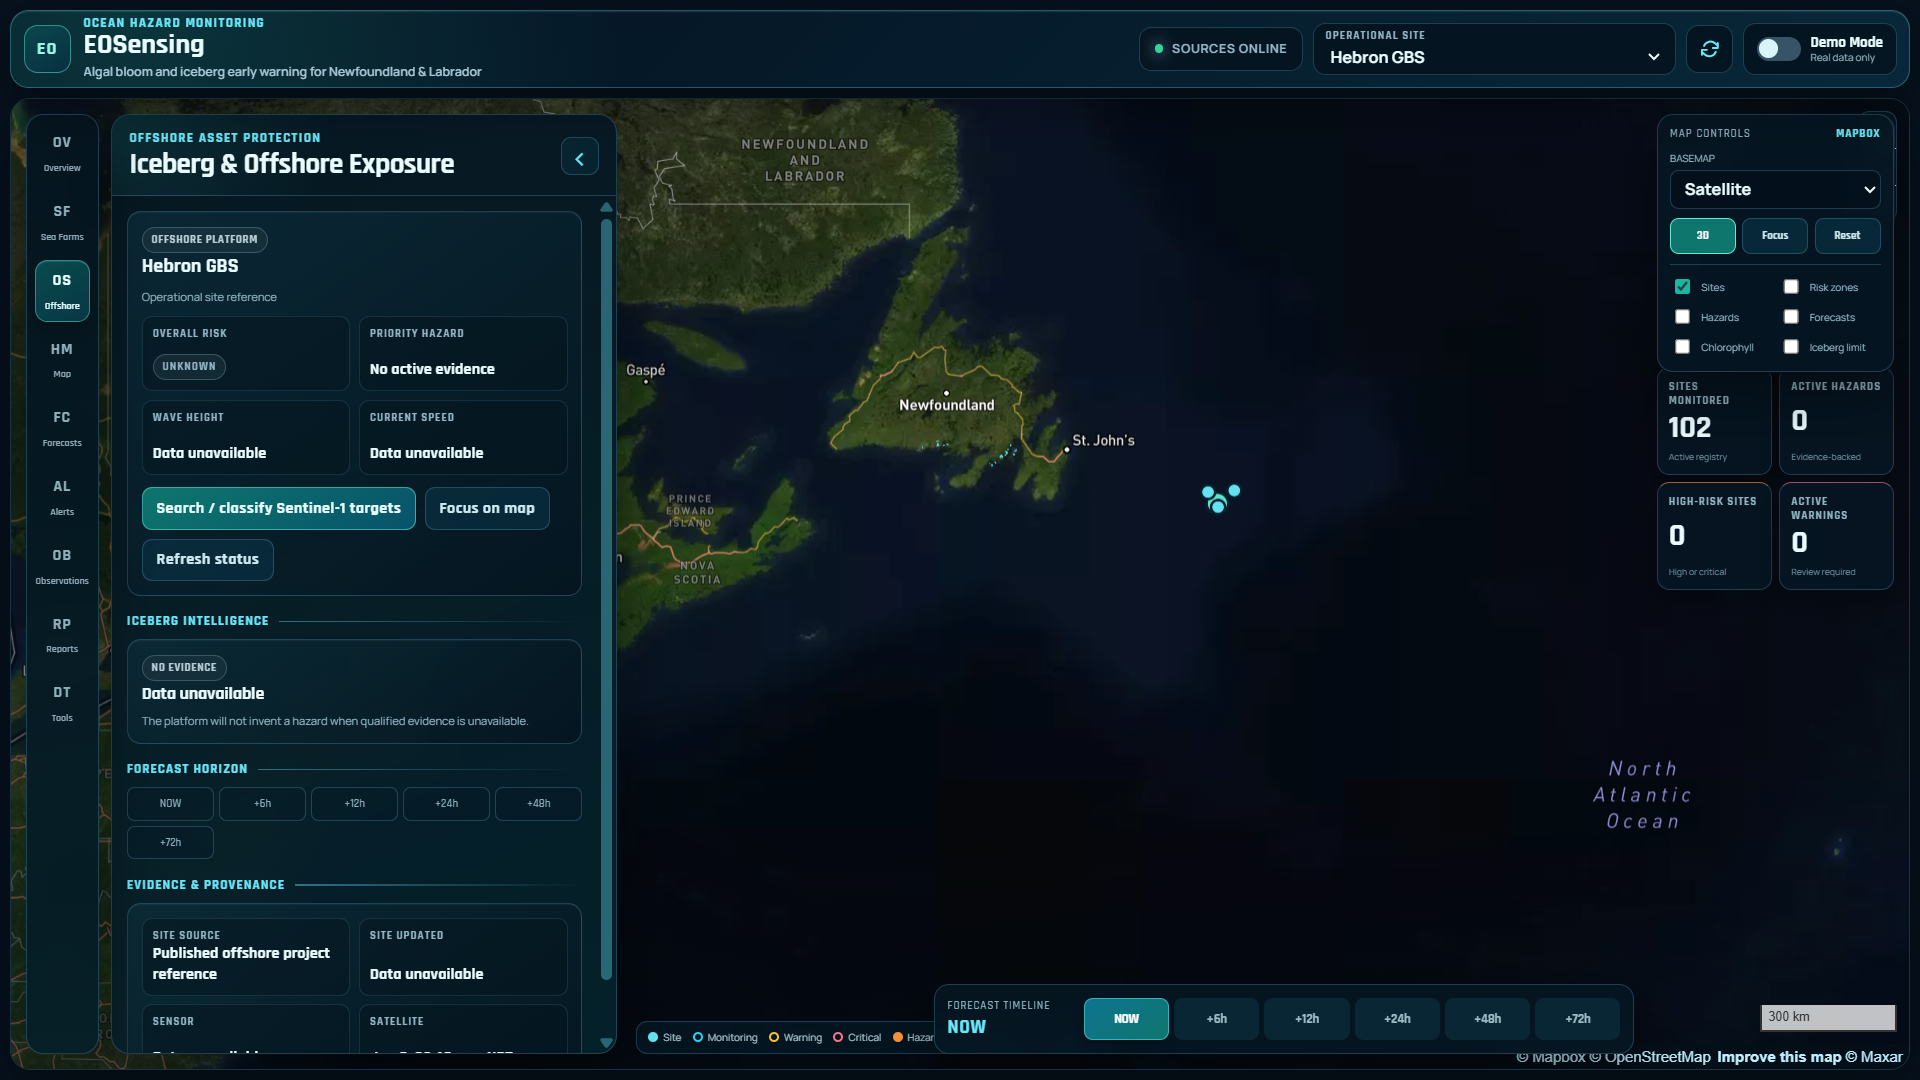
Observations, forecasts, and source evidence in one spatial view.
Water quality layers for turbidity, surface temperature, and chlorophyll.
Regional depth layers to support coastal and offshore review.
Oxygen, salinity, and other submitted sensor readings linked to each site.
LET’S TALK
Tell us where you operate and what you need to understand. We’ll explore the right platform or pilot with you.
We build geospatial intelligence platforms that connect Earth observation, AI, and operational context across wildfire, infrastructure, and coastal environments.
Coverage and update times depend on the source and region. Detections indicate potential activity; scenarios explore possible outcomes. Use these insights alongside official local advisories.
Choose a product, or let us help you find the right fit.